Welcome to the R for Marketers tutorial!
This tutorial’s main goal is to exemplify how you can use the R programming language as an automation and workflow-speedup tool.
The example given is a classic one, creating ads.
There will not be an introduction to the language itself, but instead comments regarding the approach taken to solve each step in our problem of leveraging existing ad structures in order to reduce the effort needed to make new ads.
You’ll learn how to make new ads much more easily with the POWER OF R!, With R you can access your google ads account and recycle existing ads to make your new one. The ultimate time saver!
This tutorial tries to show you how to write code in R as it should be. A lot of people try to code R as if it was Python. R is not Python. R is a Functional Programming Language and needs a completely different approach to programming. Functional Programming is also arguably easier for beginners to learn than Object Oriented.
N.B Make sure that you have a google developer token beforehand. If you do not know how to get one, ask your superior.
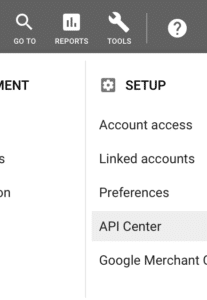
How to check if you have a token already or not:
Go to your agency’s MCC and click on Tools, then click at “API Center”. It will be clear whether you have it or not.
Part 0: Introduction
So, first of all, what is R?.
R is a Programming language that was made by statisticians for statisticians and analysts.
In case you feel that you need to check how R is before diving deep in this tutorial, there is only one tutorial I can recommend. It is Datacamp’s Introduction to R.
Go to datacamp.com and search for it. It is an interactive tutorial, so no worries about setups yet :).
Why should you use R?
- It is very easy to set up
- Centralized language with only one version being actively supported
- A huge community with packages to help you code whatever you want(examples: dealing with google ads & tag manager programmatically)
- Needs very little to no extras required for our use-case scenario
- It Is not Python or Javascript
How can it impact your job right away?
- Will (almost)stop you from using spreadsheets and excel
- Learning skills(R) rather than tools(excel) will increase your competitiveness in the job market, and opens careers that earn orders-of-magnitude more than any non C level marketing career.
- You will be able to check and aggregate any information from your ads accounts,
- Know how to make the prettiest-and-easy-to-plot graphics any tool can make.
- And apply the widest selection of Machine Learning algorithms available, to your data!
Why use R over Excel and how can it benefit you:
- R is free.
- R is well-documented.
- R runs (really well) on *nix as well as Windows and Mac OS.
- R is open-source. Trust in the R software is evident by its support among distinguished statisticians. However, the R user need not rely on trust, as the source code for R is freely available for public scrutiny.
- R has a much broader range of statistical packages for doing specialist work.
- R has an enthusiastic user base who can offer helpful advice for free.
- R creates far better graphics than Excel.
- R has certain data structures such as data frames that can make analysis more straightforward than in Excel.
- R is better for doing complex jobs
- R is a better educational tool as it uses standard statistical vocabulary rather than home-baked terminology.
- R is easier to learn, use, and script than Excel.
- R allows students easily to work with scripts, thus allowing the work to be reproducible.
- R is intended to lead students towards programming; Excel is designed to keep people away from programming and encourages them to rely on someone else doing their programming (and often their thinking) for them.
- Excel is known to be inaccurate whereas R is thoroughly tested. For a critique of Excel, see McCullough & Heiser (2008).
- The statistical package available in Excel is very limited in capability and should only be used by experienced applied statisticians who can work out when its output should be ignored.
- While R takes a while to learn, it provides a broad range of possible analyses and does not constrain users to a very limited set of methods (as is the case for Excel).
Taken from Hyndsight.
Part 1: Downloading
Firstly go to the R foundation website, and download R: https://cloud.r-project.org
Besides R, we also need an IDE. IDE stands for Integrated Development Environment.
Think of it as a neat collection of tools made to make your life easier. It is a custom interface made specifically for our purpose!
The same way Google Ads Editor makes things easier, RStudio does it too in almost the same manner.
Instead of writing code in plaintext without checking for errors, the IDE can check it as we write.
It enables us to view our graphics right next to our code, view csv tables that we are working with and a heap of features such as: connecting to databases, setting it up as a server so you can always access your code regardless of which computer you’re using and many others. here is the link to download it: Download RStudio’s Desktop version
Hopefully you didn’t just download R and RStudio but also installed it, so let’s check it. N.B Install R BEFORE Rstudio.
Go to your terminal, WIN + R on windows or for mac it is: command+space then type terminal
Type “R”(without quotes, please)
If all is correct, you will get a message showing R’s version and that it comes with no warranty, since it is an Open Source project.
Part 2: Set up
Now here comes the slightly annoying part, getting API keys from google in order to prove that you are indeed allowed to work with your Google Ads accounts.
Go to your google ads MCC account(it will most likely be your PPC agency account) and click Tools on the upper right corner of the screen, right next to the question mark.
Click API Center and check if there’s a Developer Token there, if there is then copy it somewhere. If you do not have a Developer Token you will have to apply for it.
Next up you will get the permission from google for you to create your own API project. So far we have only asked for permission to use your specific google ads account programmatically(what we did in the last step), now you have to match google’s permission to work with your google ads account(Developer Token) with your own google API project.
Go to Google’s API Console and create a project. Name it something that you will remember.
By now you should be at the “API Library”, click on the upper left arrow to return to your dashboard. If you are already at the Library then stay there.
Select Credentials and select “OAuth client id”. You might be prompted to “set a product name on the consent screen”. If that happens, then just accept it and under “Application name” just give it a name, all should be good after that and you will most likely end up in the Application Type selection.
Select “Other” from the list of options (Web App, Android, Chrome App, iOS)
Copy your Client ID and Client secret somewhere safe, alongside your Developer Token from step 2.
Part 3: Actual coding
We are past the most annoying parts and can finally get hands on with coding, So launch RStudio!
On the top left select “File” then “New Directory” and finally “New Project”. Name it accordingly.
Now on the top left, click the blank sheet symbol with a + sign and select R Script.
Voila! You are now 100% ready to write your code.
Since you are a marketer and this is maybe your first experience with R, it doesn’t make any sense to hardcode all the complicated requests to Google Ads’ API. And that is where R is great! It is very easy to reuse code made by other people in your own project! It takes literally one line!
We will use two R packages in the entire project, RAdwords and Tidyverse. RAdwords makes working with Google Ads’ api a breeze! You just write what you want and you will have it. Tidyverse is a complex ecosystem of highly curated packages made by RStudio that arguably leverage the best of R.
1) Firstly we will install our packages, which can be done very easily so with the function:
install.packages()
So your first lines should look like this:
install.packages("RAdwords")

install.packages("tidyverse")
2) Now that you have installed the packages, it is time to call them to be used in our script. We will do that using the library() function
library("RAdwords")

library("tidyverse")
3) Next we will use all the information you have stored somewhere from Part 2 with the very simple doAuth() function.
google_auth <- doAuth()
In the code block above we are calling the doAuth() function to authenticate ourselves and link the Developer Token to our Google API Project credentials. The <- means attribution, so we are storing the information from the doAuth() function in a variable named google_auth. Always make sure to use sensible and readable names for your functions! Do not name them jkajakj5!
4) Select everything you’ve written in RStudio and click Run. On the console(lowest window, under the scripting one) you will be prompted to insert your Google Project’s client id, client secret and lastly your Developer token.
After all this, a browser window will be opened requesting you to login with your email, use the same email that you’ve created your project with.
Copy the code that google will give you back to RStudio’s command line. You should be done now!.
NB! R is a Scripting language. It can execute lines of code independently of order, as long as it doesn’t reference something that does not exist yet. It means that if you select just to install tidyverse instead of RAdwords it will do. So make sure to always select exactly the lines I’m telling you to do so. R will never run the whole script unless you explicitly tell it to do so.
Part 4: Getting the Data
Having downloaded R, installed it, went through all the bureaucracy needed to get Google’s APIs and credentials and installed the packages we can finally start to query our Google Ads’ accounts.
So, in short, what do we have to do to get the data from our accounts?
- Send a request to google
- Have the request authenticated
- Store the data from the request in a variable
In order to send the request, we first need to make a “body”. In that body we will write a statement explaining what you want from your account. The statement needs at least four arguments:
- Select: What parts of the data you want, such as Headline 1, Campaign name…
- Report: What kind of report? Do you want information about ads, adgroups or campaigns?
- Start: From when do you want to limit your query from?
- End: Until when do you want your data to go up to?
The “body” of our request is done using the statement() function from the RAdwords package. Sys.Date() is just a function that returns the current Date. the seemingly random c before the list of things you want is used to denote just that. c() is used when you want to combine things. In this case, you want to combine all the basic AD information into a list.
You’ll notice that the names for some attributes such as Final URL are a bit cryptic. I do not know why on earth it is named “CreativeFinalUrls”. You can check which names to use in order to get whatever you want here: https://developers.google.com/adwords/api/docs/appendix/reports/ad-performance-report
body_ads <- statement(select = c(

"CampaignName",

"AdGroupName",

"AdGroupStatus",

"Description",

"HeadlinePart1",

"HeadlinePart2",

"Path1",

"Path2",

"CreativeFinalUrls",

"CampaignStatus",

"Labels"),

report = "AD_PERFORMANCE_REPORT",

start = Sys.Date() - 1,

end = Sys.Date())
Now we have to actually send that request to google and store that data into an in-memory variable so we can use it later.
We can do that using the getData() function and inputting our previously defined body variable alongside our authentication variable.
data_ads <- getData(clientCustomerId='666-666-6666', google_auth=google_auth, body_ads) %>%

filter(Campaignstate == "enabled")
You might ask, what is %>%?. %>% is a “piping operator”, and it does something quite simple. In the filter() function the first argument needs to be the variable that you are referencing to, in our case data_ads, because the second argument Campaignstate is an attribute of the data stored in data_ads. The %>% operator automatically passes the variable data_ads, sort of “linking” both getData() and filter() so you don’t have to create another variable.
Part 5: Preparing the Data
Having the data on hand, you might ask “Ok..but on excel I can see my data straight away! How can I do it too with R?” The answer to that is very simple. If you want to visually inspect your data you can do so right on RStudio. Just click on the Environment tab to the right of the screen, then click on the table icon to the right of data_ads and voila! You have a table in which you can sort, search and arrange just like in excel.
Back to the coding: Let’s filter that data and get a nice looking list with every distinct ad group.
adgroups <- data_ads %>%

distinct(Adgroup, Campaign, .keep_all = TRUE) %>%

select(-Labels)
Pretty straightforward bit of code. We use the function distinct() to select all unique combinations of existing Adgroups and Campaigns. The .keep_all option is to not only print Adgroup and Campaign but all the other dimensions as well (Description, Headline1, etc).
Part 6: Making the ads
For this Part we will consider that: You only want to add a single batch of ads and you already have the Headlines and Descriptions on hand.
In order to store the Ads in memory, we will use the c() function again and store the generated lists into a tibble. A tibble is just a tabular data format(like excel spreadsheets) that is used by the tidyverse.
new_ads <- tibble( Headline1 = c("new_headline_1"),Headline2 = c("new_headline_2"), Description = c("new_description"), Description2 = c("new_description2”))
You can store anything in that tibble that you’d like to swap in the adgroups tibble: “CampaignName”, “AdGroupName”, “AdGroupStatus”, “Description”, “HeadlinePart1”, “HeadlinePart2”, “Path1”, “Path2”, “CreativeFinalUrls”, “CampaignStatus”, “Labels” However let’s just keep it simple for now and only add a new batch of ads, for all adgroups in our account, that only consist of changed Headlines and Descriptions.
We will use the %>% operand to make a pipeline in which we will mutate() adgroups with our newly created new_ads tibble
new_adgroups <- adgroups %>%

mutate(

Headline1 = new_ads$Headline1[1],

Headline2 = new_ads$Headline2[1],

Description = new_ads$Description[1],

Description2 = new_ads$Description2[1]

)
The syntax might seem a bit odd, but it actually isn’t. Let’s deconstruct it:
The mutate() function uses adgroups as an input, and then changes its Headline1, Headline2, Description , Description2 fields to the respective fields in new_ads. Now, taking the a bit alien new_ads$Description[1] we can dissect it as: $ is used to access the column Description (Remember a tibble is a tabular form of data very similar to a spreadsheet in terms of representation) and from that element, get the first row [1] from that column only.
Part 7: Uploading to google sheets
At last! soon we will have all the ads you have carefully manipulated/crafted in your own area of expertise, an actual spreadsheet.
Google Sheets has been chosen instead of excel because it is more convenient. It is extremely easy to upload a tibble into google sheets.
We will only use two functions: write_csv() in order to transform the tibble into a csv file, and then gs_upload() in order to upload it to our google sheets(you will be prompted to authorize googlesheets).
to_csv <- write_csv(new_adgroups, "new_ads.csv")

gs_upload("new_ads.csv")
Voila!
Part 8: Conclusion and Full code
Congratulations! Hopefully by now understand the benefits that R can give in order to reduce or fully automate repetitive tasks in your work.
You can reuse that code for any account you may want.
R may seem a bit daunting at first, but as with any programming language it gets very fluent as you use it more.
If you want a challange, try to change the full code into a function, that way you don’t have to change the code every time you want a new batch of ads :).
install.packages("RAdwords") #installing the “reusable code”

install.packages("tidyverse") #installing the "reusable code"
library(“RAdwords”) #setting that we can to use the code in this project

library(“tidyverse”) #setting that we can to use the code in this project
google_auth <- do_auth() #authenticating ourselves with google and saving #the authentication in memory so we can use it to make the requests
body_ads <- statement(select = c(

"CampaignName",

"AdGroupName",

"AdGroupStatus",

"Description",

"HeadlinePart1",

"HeadlinePart2",

"Path1",

"Path2",

"CreativeFinalUrls",

"CampaignStatus",

"Labels"),

report = "AD_PERFORMANCE_REPORT",

start = Sys.Date() - 1,

end = Sys.Date()) #writing what we want from google ads. Refer to google reporting api website in order to check which reports are available, pay a lot of attention to the naming scheme that google uses!.
data_ads <- getData(clientCustomerId='666-666-6666', google_auth=google_auth, body_ads) %>%

filter(Campaignstate == "enabled") #sending the request and storing it #in a variable.
adgroups <- data_ads %>%

distinct(Adgroup, Campaign, .keep_all = TRUE) %>%

select(-Labels) #making sure that we only have one copy of all ad #groups and removing the unnecessary Labels field.
new_ads <- tibble(

Headline1 = c("new_headline_1"),

Headline2 = c("new_headline_2"),

Description = c("new_description"),

Description2 = c("new_description2")

) #creating a variable that will hold the new Headlines and Descriptions #for our ads
new_adgroups <- adgroups %>%

mutate(

Headline1 = new_ads$Headline1[1],

Headline2 = new_ads$Headline2[1],

Description = new_ads$Description[1],

Description2 = new_ads$Description2[1]

) #swapping the values of our queried adgroups/ad list with our desired #values from the new_ads variable
to_csv <- write_csv(new_adgroups, "new_ads.csv") #converting our #in-memory table to a .csv file(it could have been an xlsx file)

gs_upload("new_ads.csv") #uploading our table to googlesheets!